. 2015 Sep 16;8(1):69–78. doi: 10.4168/aair.2016.8.1.69

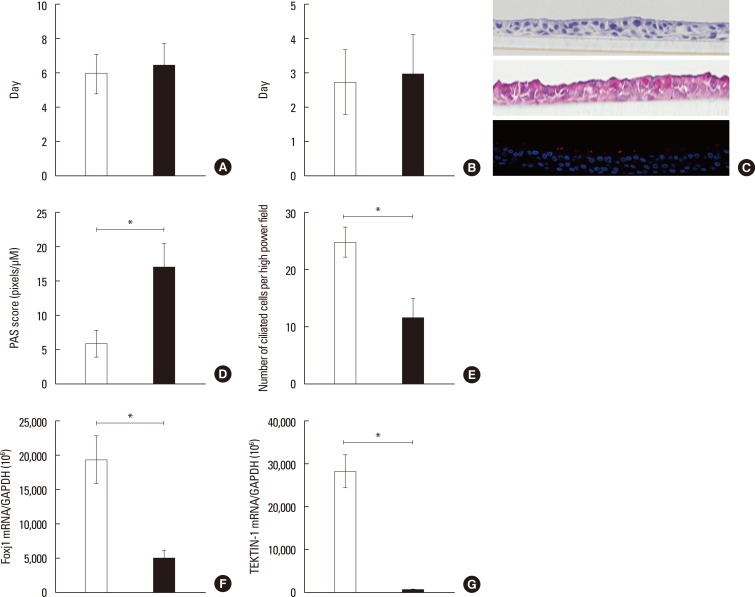
Fig. 4. Comparison of mean period for proliferation and differentiation in NHNE and ARNE cells. (A) Comparison of mean days taken for subculture in NHNE and ARNE cells. (B) Comparison of mean days taken for confluence in ALI culture of NHNE and ARNE cells. The results are presented here as the mean±SD (white bar: NHNE cells, black bar: ARNE cells). (C) Cross section (5 µm) of ARNE cells at 14 days after confluence stained with H&E (upper panel), PAS (middle panel) and immunofluorescence (lower panel, red color: α-tubulin IV, blue color: DAPI) (original magnification ×200). (D) Numbers of secretory cells expressed as a PAS-positive score 14 days after ALI confluence in NHNE and ARNE cells. (E) Numbers of ciliated cells per high power field 14 days after ALI confluence in NHNE and ARNE cells (white bar: NHNE cells, black bar: ARNE cells). The mRNA levels of Foxj1 and TEKTIN-1 are considerably lower in ALI culture of ARNE cells. Real-time PCR showed that Foxj1 (F) and TEKTIN-1 (G) mRNA levels are attenuated in ARNE cells 14 days after confluence. Results are presented here as the mean±SD from eight independent ALI cultures (* P<0.05 compared to mRNA levels in NHNE cells).

Fig. 4