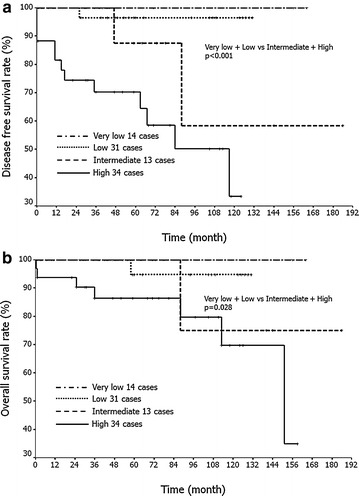
Fig. 1.

Kaplan–Meier analysis based on the risk classification (modified NIH consensus criteria). Intermediate-risk or high-risk tumors show significantly shorter disease free survival (a: P < 0.001) and overall survival (b: P = 0.028) compared to very low-risk or low-risk tumors. Disease-free survival rate: very low vs. low, P = 0.55; low vs. intermediate, P = 0.108; very low vs. intermediate, P = 0.225; intermediate vs. high, P = 0.121; very low vs. high, P = 0.015. Overall survival rate: very low vs. low, P = 0.646; low vs. intermediate, P = 0.515; very low vs. intermediate, P = 0.387; intermediate vs. high, P = 0.322; very low vs. high, P = 0.065
