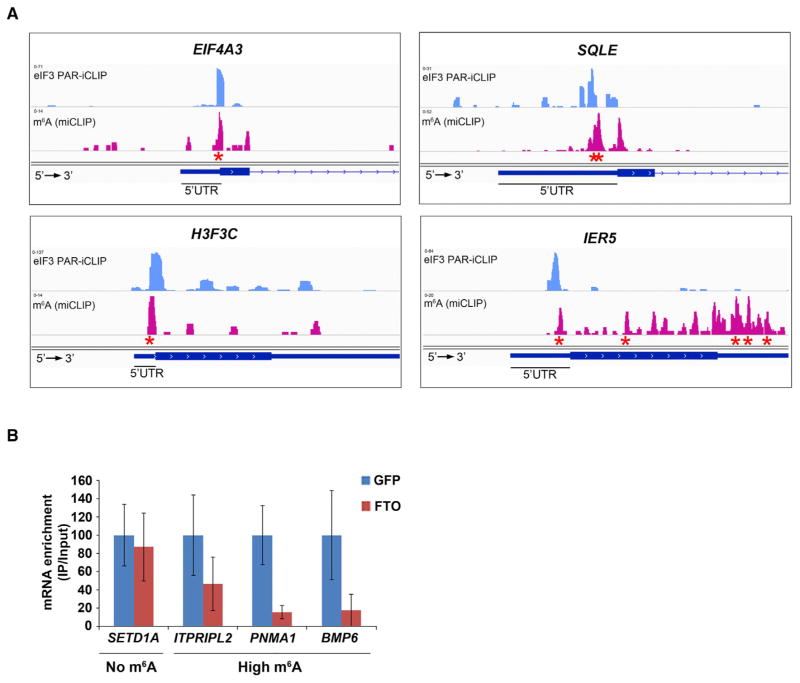
Figure 5. eIF3 Binding Sites within Cellular mRNAs Localize to Sites of m6A Residues within the 5′ UTR.
(A) Shown are read clusters from both eIF3 PAR-iCLIP (light blue) and single-nucleotide-resolution m6A mapping (Linder et al., 2015) (miCLIP; red) for four representative mRNAs (EIF4A3, H3F3C, SQLE, and IER5). eIF3a PAR-iCLIP read clusters exhibit highly specific overlap with m6A mapping clusters at internal positions within 5′ UTRs. This co-localization is specific to 5′ UTRs, as mRNAs that contain multiple m6A residues in the CDS or 3′ UTR fail to show eIF3a binding at these sites (exemplified by IER5). Red asterisks indicate the location of individual m6A sites identified at single-nucleotide resolution.
(B) eIF3 binds to the 5′ UTR of cellular mRNAs in an m6A-dependent manner. HEK293 cells were transfected with GFP- or Fto-overexpression plasmids, and eIF3 immunoprecipitation was performed to isolate eIF3-bound mRNAs. Bound mRNAs were quantified by RT-qPCR using 5′ UTR-specific primers. 5′ UTRs of mRNAs that contain high levels of m6A exhibited reduced binding to eIF3 after overexpression of Fto. 5′ UTRs that do not contain m6A exhibited no change in eIF3 binding following Fto overexpression (n = 3; mean ± SEM).
See also Figures S4 and S5.

