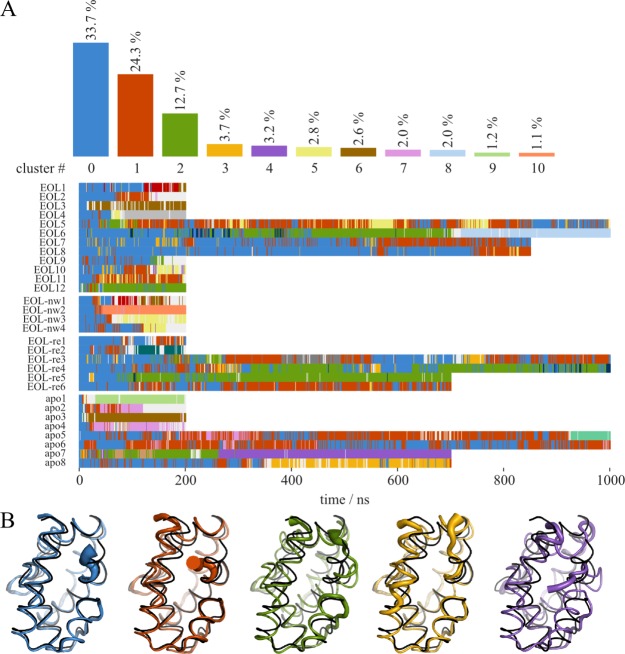
Figure 3.
Analysis of conformational clusters obtained with a 0.2 nm backbone atom RMSD cutoff. (A) Overall occurrence and time series of the clustered conformations (clusters with an occurrence <1% were left out in the top bargraph). Cluster 0 (in blue) was enforced around the crystal structure. (B) Average structures of clusters 0–5 using the same color code as in A, overlaid on the crystal structure (black). The thickness of the tube representation corresponds to the local RMSF in all the snapshots assigned to the respective cluster.

