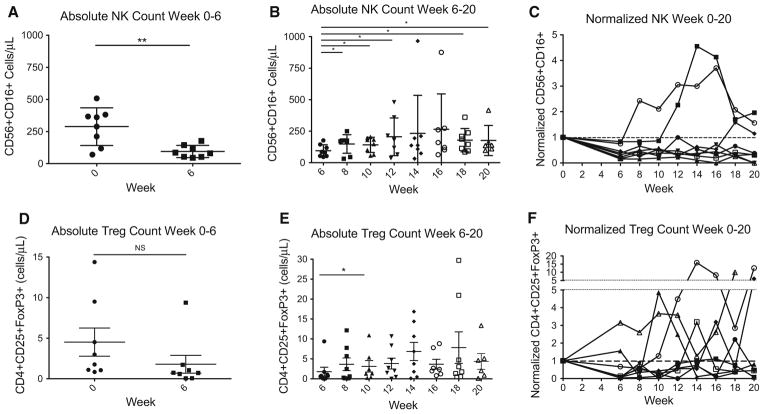
Fig. 2.
Effects of treatment and lymphocyte reinfusion on NK and Treg cells. a Absolute NK cell counts from week 0 to 6 while patients were treated with concurrent RT/TMZ; b absolute NK cell counts from week 6 to 20 after lymphocyte reinfusion; c normalized NK cell counts from week 0 to 20 during the study period (normalized to baseline), plotted individually for each patient in the study; d absolute Treg cell counts from week 0 to 6 while patients were treated with concurrent RT/TMZ; e absolute Treg cell counts from week 6 to 20 after lymphocyte reinfusion; f normalized Treg cell counts from week 0 to 20 during the study period (normalized to baseline), plotted individually for each patient in the study asterisk denotes p value <0.05. Double asterisks denotes p value < 0.01

