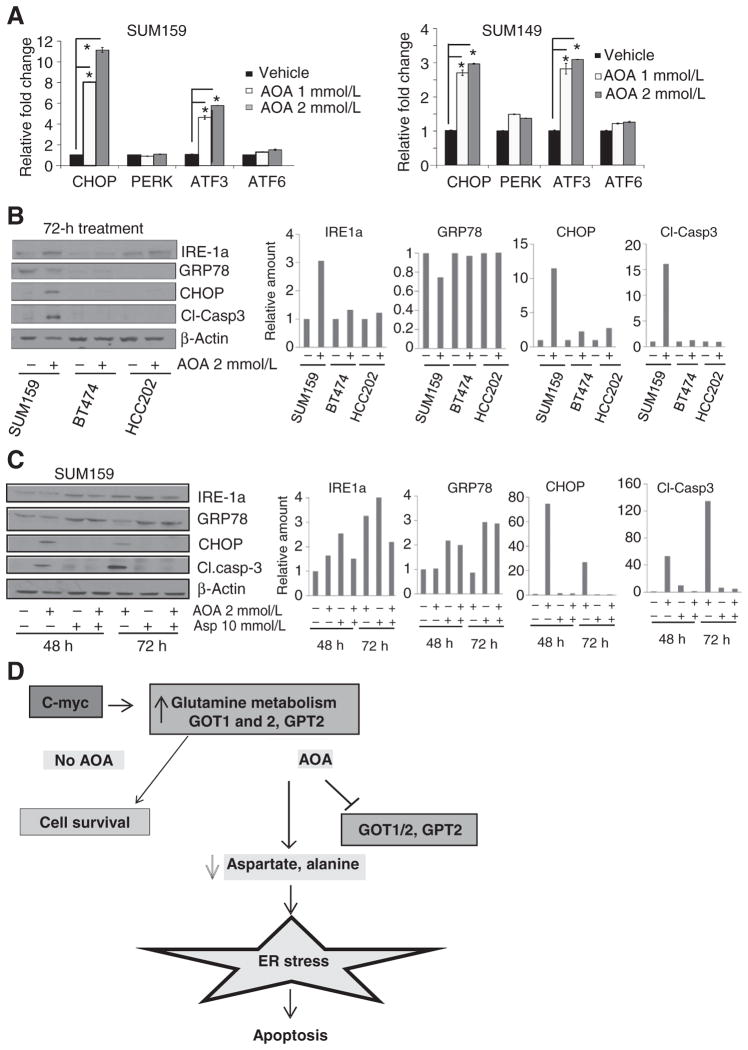
Figure 5.
Molecular mechanism of AOA-induced growth inhibition and death. A, RT-qPCR analysis of SUM159 and SUM149 cells showing induction of ER stress markers after 24 hours exposure to 2 mmol/L AOA (duplicates in each assay; three replicate assays). The Student t test, two-tailed *, P ≤ 0.05. B, Western blot analysis for stress markers and apoptotic marker caspase-3 comparing AOA-sensitive SUM159 with AOA-insensitive BT474 and HCC202 cell lines after 72 hours exposure to 2 mmol/L AOA. C, induction of ER stress markers and caspase-3 is reversed by addition of aspartate to SUM159 and SUM149 cells following 48 or 72 hours of treatment with AOA; bar graph, quantitation. D, schema of proposed mechanism of action of AOA in breast cancer cells.

