Fig. 3.

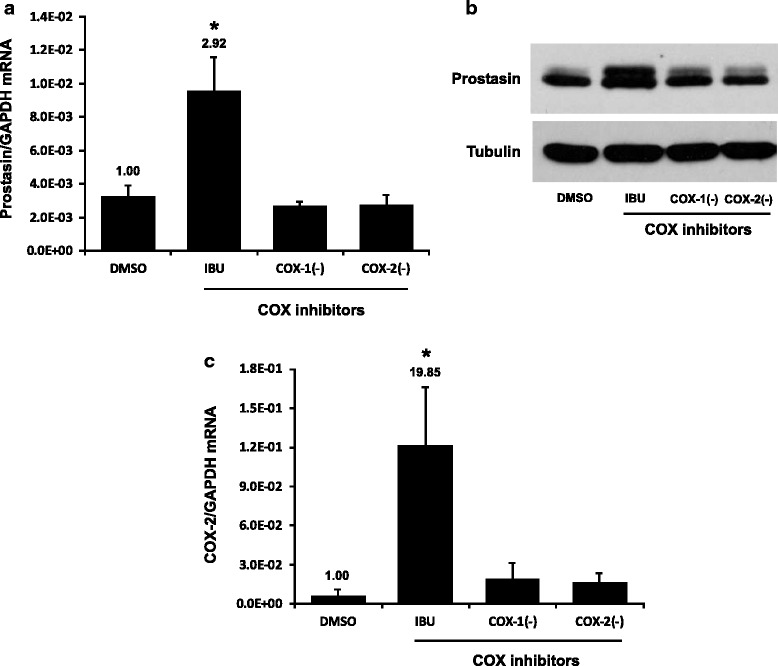
Selective COX inhibitors did not affect prostasin expression. The UROtsa cells were treated with COX inhibitors for 24 h. IBU: ibuprofen, 2 mM; COX-1(−): COX-1 inhibitor, 10 μM; COX-2(−): COX-2 inhibitor, 10 μM. a & c RT-qPCR (n = 3). The numbers above each bar indicate the fold change of the expression as compared to the DMSO control. Note: the bars of DMSO and IBU in (a) and (c) are the same of those in Fig. 1a and Fig. 2a, respectively. One-way ANOVA and Tukey’s post hoc were used for data analysis, and p < 0.05 was considered statistically significant. The asterisk denotes p < 0.05 between IBU treated and DMSO control cells. b western blotting (representative image from three experiments)
