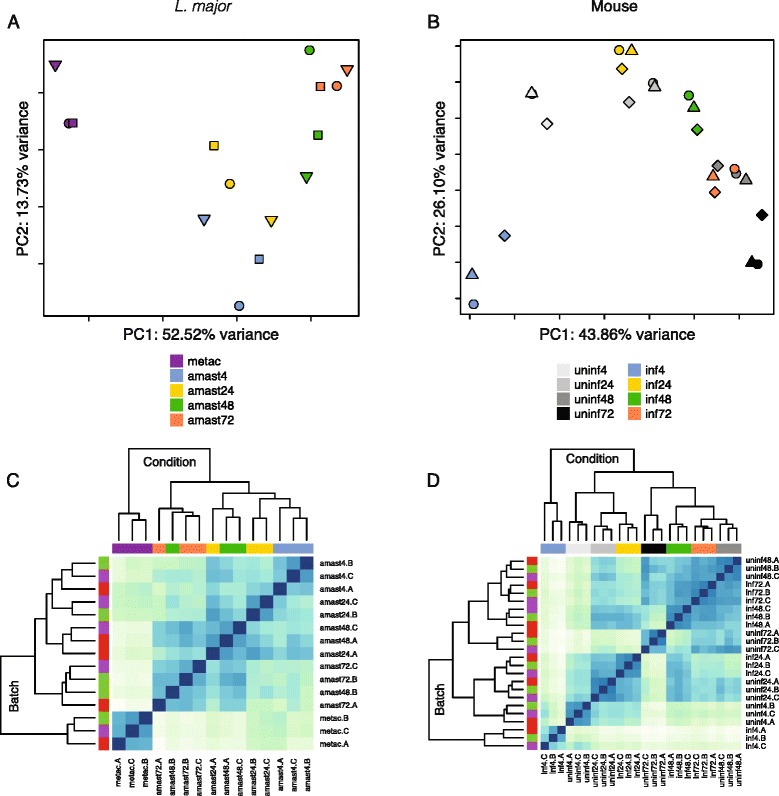
Fig. 2.

Global gene expression profiles of L. major parasites and their murine macrophage host cells. RNA-seq was carried out on mouse macrophages infected with L. major at 4, 24, 48, and 72 hpi as well as on the metacyclic promastigotes used for the infection. Principal component analysis (PCA) plots and heatmaps of hierarchical clustering analyses using Euclidean distance are shown for the L. major (a, c) and mouse (b, d) transcriptomes over the course of the experiment. The analyses were performed using all annotated protein-coding genes following filtering for low counts and quantile normalization after accounting for batch effects in the statistical model (8479 genes for L. major and 12552 genes for mouse). In the PCA plots, the first two principal components are shown on the X and Y axes, respectively, with the proportion of total variance attributable to that PC indicated. Each experimental sample is represented as a single point with color indicating sample type/timepoint and shape indicating experimental batch. Colors along the tops of the heatmaps indicate the sample type/timepoint and colors along the left sides of the heatmaps indicate the experimental batch. Samples are named according to sample type (“metac” for L. major metacyclic promastigotes, “amast” for L. major amastigotes, “uninf” for uninfected mouse macrophage, or “inf” for L. major-infected mouse macrophage), timepoint (4, 24, 48, or 72 hpi) and experimental batch (a, b, or c) (see Additional file 1)
