Fig. 2.

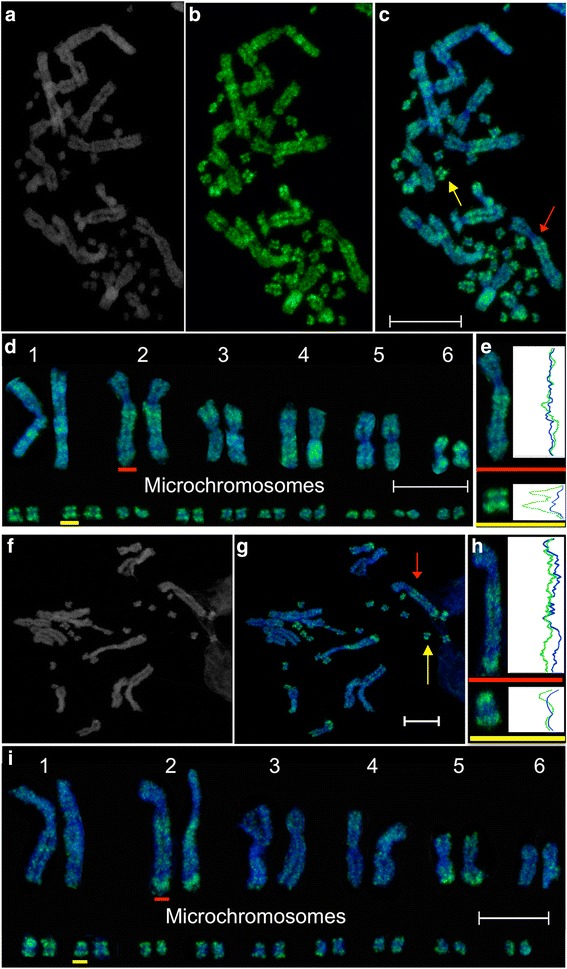
Immunofluorescent staining of active marks H3K4me2 and H3K4me3 on Pogona vitticeps metaphase chromosomes. Distribution of H3K4me2: (a) DAPI stained chromosomes, (b) H3K4me2 staining and (c) merged image, (d) karyotype of chromosomes depicted in image c. e Representative line scans of staining on a macrochromosome (red) and microchromosome (yellow). The blue curves correspond to the DAPI staining along the length of the chromosomes. The green curves show the distribution of each epigenetic mark. Distribution of H3K4me3: (f ) DAPI stained chromosomes, (g) merged image showing H3K4me3 staining in green and DAPI staining in blue. h Representative line scans of staining on a macrochromosome (red) and microchromosome (yellow). i Karyotype of chromosomes depicted in image g. Scalebars represent 10 μm
