Fig. 4.

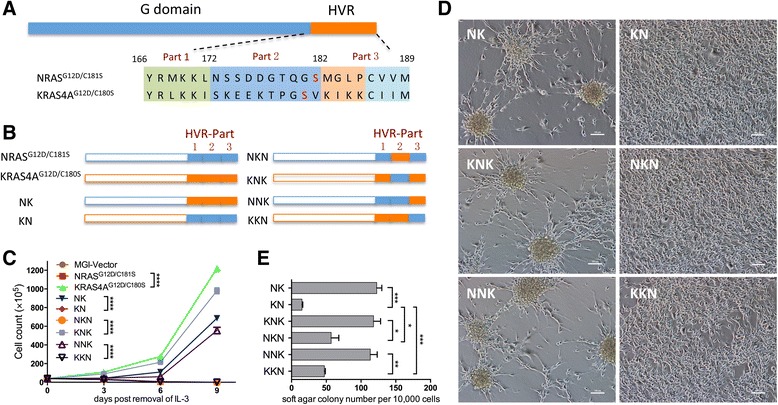
Identification of sequences rendering palmitoylation defective oncogenic KRAS4A transformation active. a The sequence alignment of the hypervariable regions (HVRs) of NRAS vs. KRAS4A. The shaded areas in green, blue, or orange indicate the sequences separated according to the lysine enrichment. Part 1: amino acids 166–172; part 2: amino acids 173–182; part 3: amino acids 183–189. b Diagram of NRASG12D/C181S and KRAS4AG12D/C180S C-terminal domain chimeras. The total C-terminal domain, part 2 or part 3 was swapped respectively to generate NK, KN, NKN, KNK, NNK, and KKN. c Growth curves of Ba/F3 cells overexpressing the indicated proteins after removal of IL-3. Student t test was used for the statistical analysis of the cell numbers in each timepoint. ****P < 0.001. d Morphology of cultured NIH3T3 cells stably expressing the indicated proteins was observed under light microscope (original magnification, ×200). e Quantification of anchorage-independent growth of NIH3T3 cells expressing the indicated proteins. Colonies were counted on day 14 after plating in triplicate. Student t test was used for the statistical analysis. *P < 0.05, **P < 0.01, ***P < 0.001
