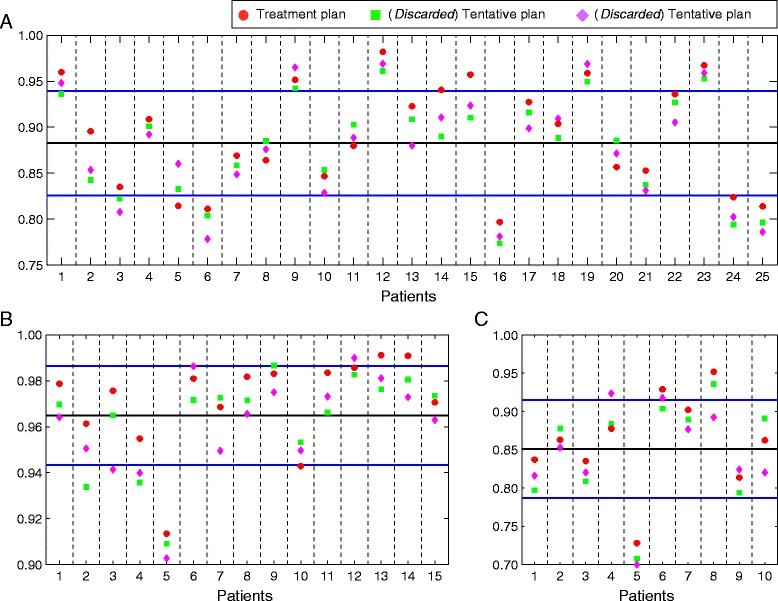
Fig. 2.

Plots of the DDI scores for each set of three tentative plans corresponding to the fifty brain cancer patients considered. Applied treatment plan in red, and discarded tentative plans in green and purple. a 25 centrally located benign tumors. b 15 peripherally located benign and malignant tumors. c 10 centrally located malignant tumors. Mean DDI scores (black solid lines) and standard deviations (blue solid lines) are also represented
