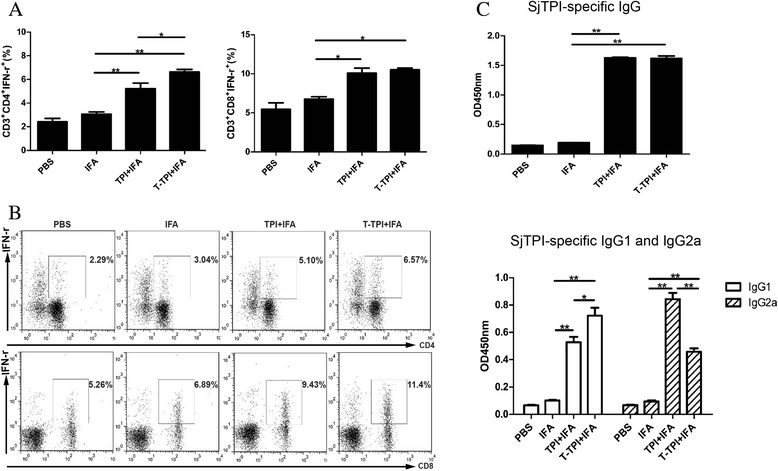
Fig. 4.

T cell and antibodies responses after three immunisations with T-TPI + IFA, TPI + IFA, IFA and PBS. a and b: Percentages of CD3+CD4+IFN-γ+ (Th1) and CD3+CD8+IFN-γ+ (Tc1) gated from CD3+ cells analysed by FACS. c. IgG, IgG1 and IgG2a levels in mice sera were detected. Data are presented as the means ± SEM from eight mice in each group. (*P < 0.05; **P < 0.01)
