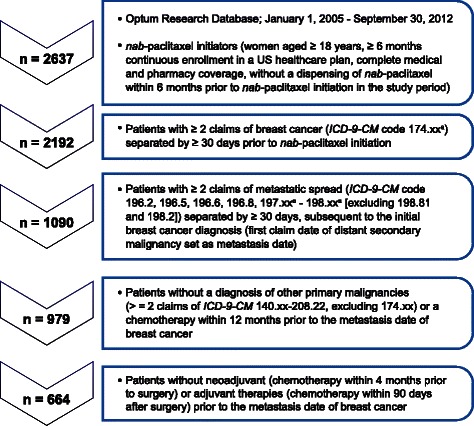
Fig. 1.

Flowchart of study patients. Patients in the Optum Research Database who met the criteria outlined in the flowchart were included in the claims analysis. axx indicates any subcode

Flowchart of study patients. Patients in the Optum Research Database who met the criteria outlined in the flowchart were included in the claims analysis. axx indicates any subcode