
Fig. 7.
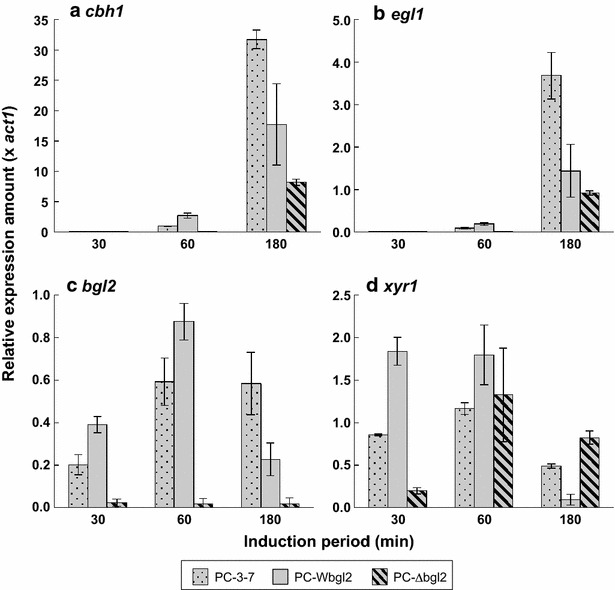
Gene expression profile of PC-3-7 transformants following cellobiose induction. Genes analyzed were cbh1 (a), egl1 (b), bgl2 (c), and xyr1 (d). Stippled gray bar represents PC-3-7, solid gray bar represents PC-Wbgl2, and the shaded gray barindicates PC-∆bgl2. Values represent the means of triplicate experiments. Error bars indicate standard deviations