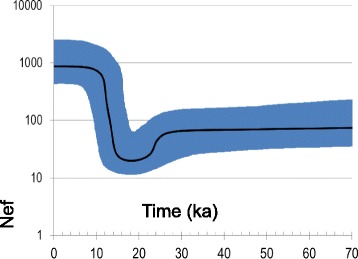
Fig. 2.

Bayesian Skyline Plot showing the goat population size trend with a generation time of 4.5 years [60]. The Y axis indicates the effective number of females. The thick solid line is the median estimate and the grey shading shows the 95 % highest posterior density limits. The time axis is limited to 100 ka, beyond that time the curve remains linear
