
Fig. 7.
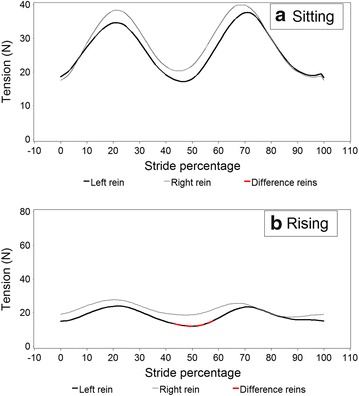
Schematic rein tension in trot on the left and right reins (rein L and rein R) during a stride based on data where the horse was ridden in a sitting trot (in the model; 6 riders, 15 horses, 16,968 data points) compared to b rising trot (6 riders, 18 horses, 20,198 data points), Stride percentages zero and 100 represent mid-stance of the right forelimb. Red coloured line sections in the left rein demonstrates significant differences between the left and right rein (note that scales are different)