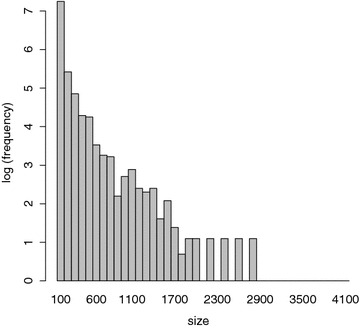
Fig. 1.

Distribution of the number of molecules associated with each protein. The x axis bins proteins by the number of small-molecule data-points with which they are associated. The y axis plots the number of proteins in each bin. There are 2108 protein targets. About 33 % of these datasets contain more than 100 molecules
