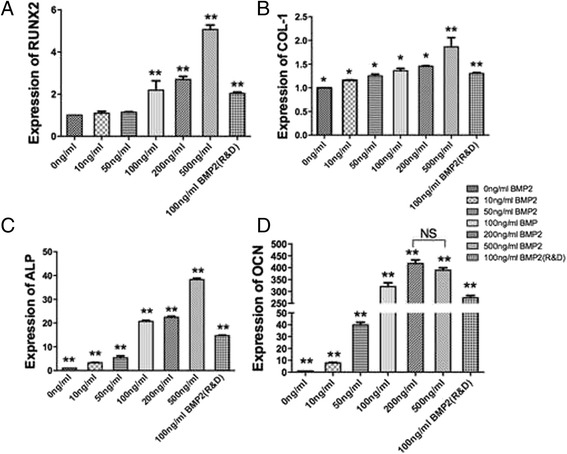
Fig. 4.

mRNA levels of (a) ALP, (b) OCN, (c) COL-1 and (d) Runx2 for MC3T3-E1 cells seeded at various concentrations of rhBMP2_108 (All experiments were conducted in triplicate with three independent experiments (n = 9). Data represents means +/− SEM. * denotes p < 0.05; ** denotes significantly higher than all other modalities, p < 0.05, # denotes control samples significantly lower than all other treatment modalities, p < 0.05)
