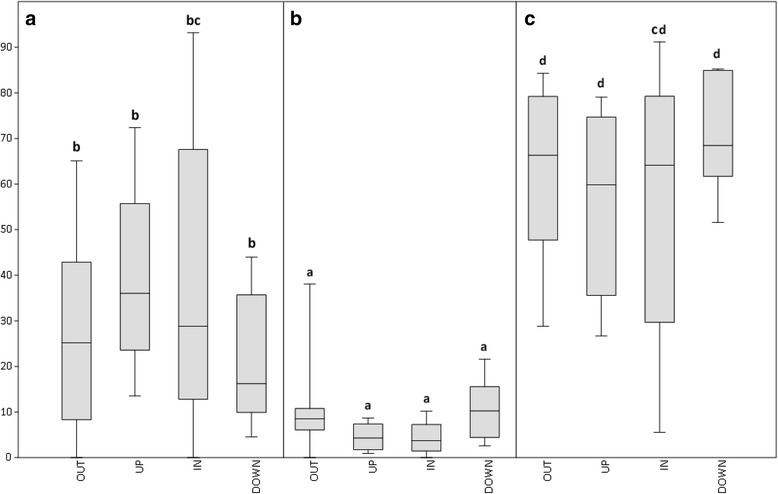
Fig. 5.

Boxplot representing variance components (%) per locus on populations of H. irregulare and H. annosum. a Variation between species; (b) Variation among populations; (c) Variation among genotypes. In the Y-axis the percentages of variation were plotted, while in X-axis the different categories of loci were represented. Boxplots with different letters are significantly different (F-test, p-value < 0.05)
