
Fig. 1.
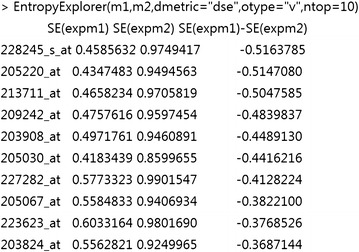
The output of EntropyExplorer on breast cancer data. The numerical matrices m1 and m2 have been read into R. The function call has specified “dse” for differential Shannon entropy, “v” for value, and 10 to return the top 10 values
Official websites use .gov
A
.gov website belongs to an official
government organization in the United States.
Secure .gov websites use HTTPS
A lock (
) or https:// means you've safely
connected to the .gov website. Share sensitive
information only on official, secure websites.
The output of EntropyExplorer on breast cancer data. The numerical matrices m1 and m2 have been read into R. The function call has specified “dse” for differential Shannon entropy, “v” for value, and 10 to return the top 10 values