Fig. 3.

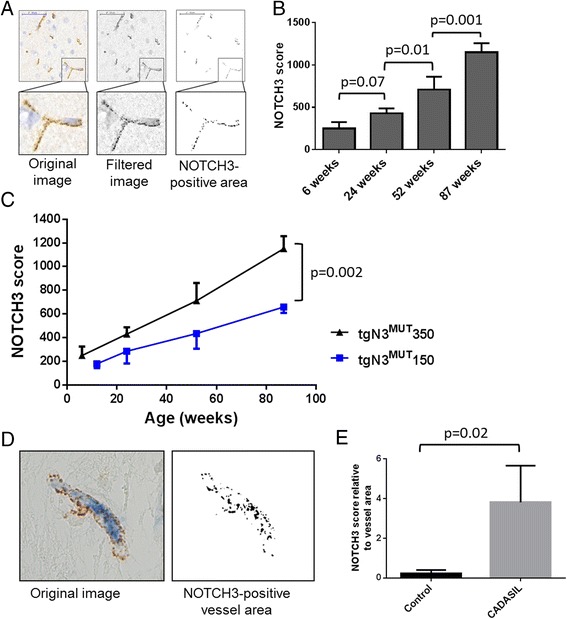
Quantitative analysis of vascular NOTCH3 protein accumulation in transgenic human NOTCH3 p.Arg182Cys mice and in brain tissue of CADASIL patients. a ImageJ processing of NOTCH3-immunostained brain sections of tgN3MUT350 mice. The images were filtered to reduce background signal and a standardised threshold was applied to determine the NOTCH3- positive area composed of individual granular NOTCH3 deposits, resulting in the NOTCH3 score. b Quantitative analysis of NOTCH3 accumulation in tgN3MUT350 mice. The NOTCH3 score shows an age-dependent increase and allows for a sensitive discrimination between age groups (One-Way ANOVA, Fishers least significant difference). c Validation of the NOTCH3 score in tgN3MUT150 mice, also showing an age-dependent increase. At each time point, the score is lower in tgN3MUT150 than in tgN3MUT350 mice (unpaired t-test), reflecting the correlation between NOTCH3 RNA expression and NOTCH3 protein accumulation. Data represent the average +/− SD of the three mice analysed per time point. d ImageJ analysis of human brain sections double stained with NOTCH3 and CD31. The vessel area was selected based on the staining with the endothelial cell marker CD31, and within this area, the NOTCH3 score was determined. e CADASIL patients show a significantly higher NOTCH3 score than age-matched controls. (unpaired t-test) Data represent the average +/− SD of three CADASIL patients and three control individuals
