Fig. 5.
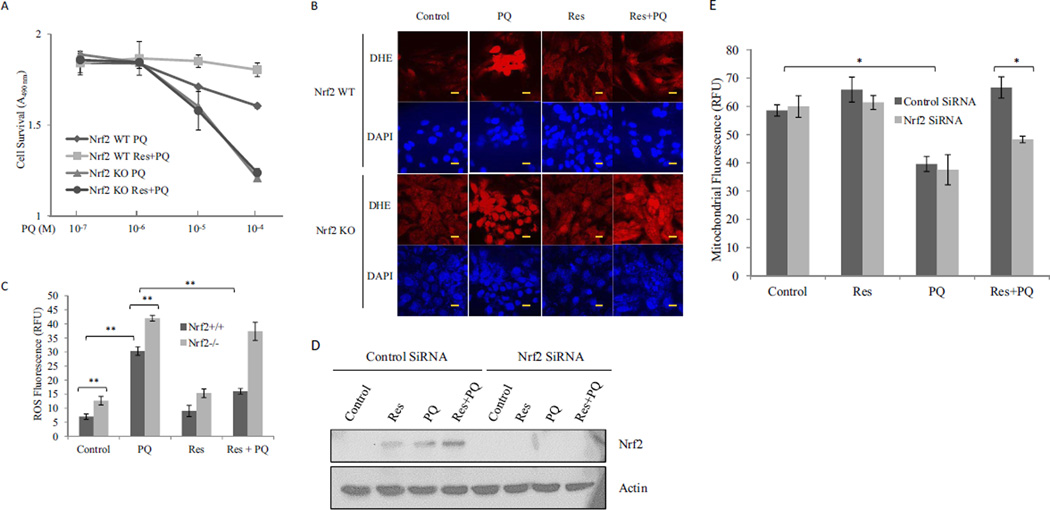
Nrf2-dependent inhibition of PQ toxicity. A, cell toxicity. Nrf2 WT and Nrf2 KO MEF cells were treated with PQ or PQ + Res (10 µM) for 24 h in triplicate. Cytotoxicity was measured and analyzed as described for Fig. 1. B, ROS production. Nrf2 WT and Nrf2 KO MEF cells were treated with PQ (10 µM), Res (10 µM), or PQ + Res for 24 h. ROS fluorescent probe DHE was added 30 min before the end of treatment to detect ROS. DAPI was used to counterstain the nucleus. Bars, 20 nm. C, quantification of fluorescence intensity of B. D and E, BEAS-2B cells were transfected with control siRNA or Nrf2 siRNA. The cells were then treated as described for B. D, knockdown of Nrf2 was examined by immunoblotting of Nrf2 with actin as the loading control. E, mitochondrial damage was assessed by using TMRE and flow cytometry. Data represent means ± S.D. from three samples. *, p < 0.05; **, p < 0.01.

