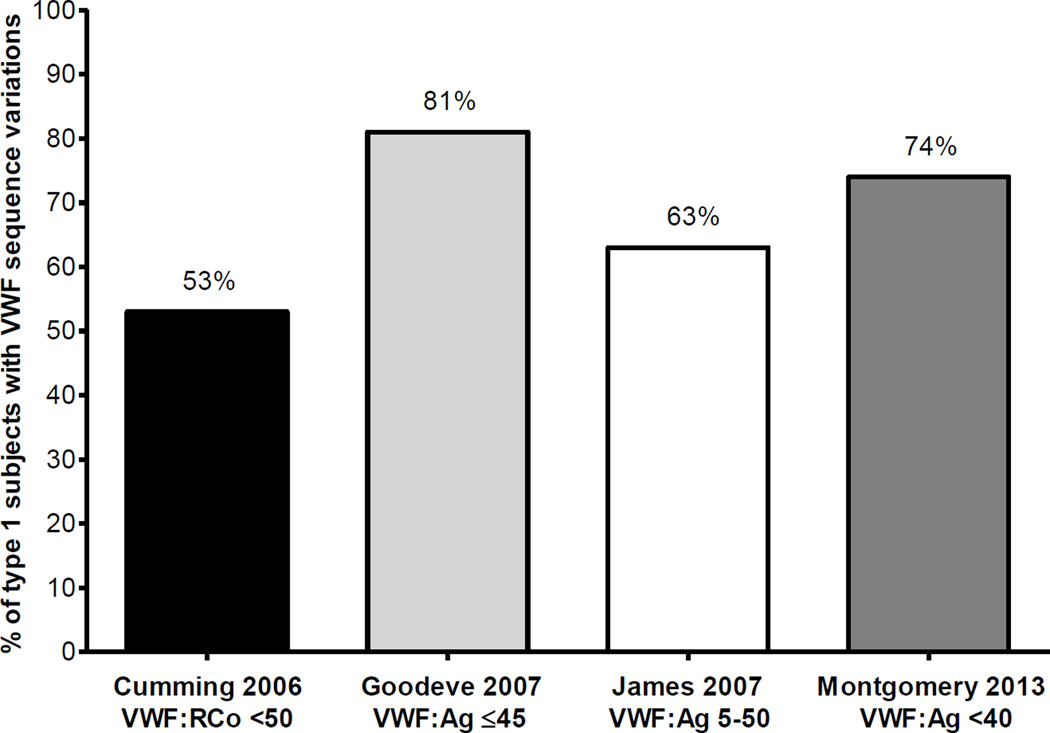
Figure 3. Rate of sequence variations in type 1 VWD studies.
This graph shows rates of sequence variations discovered in subjects with type 1 VWD in each of 4 large VWD studies. The first column (in black) represents the United Kingdom study subjects with VWF:RCo <50 IU/dL,17 the second column (in light grey) represents the MCMDM-1VWD study type 1 subjects with VWF:Ag ≤45 IU/dL,15 the third column (in white) represents the Canadian type 1 VWD study subjects with VWF:Ag between 5–50 IU/dL,16 and the fourth column (in dark grey) represents the US Zimmerman Program study type 1 subjects with VWF:Ag <40 IU/dL.18 The percent of each group with sequence variations is shown at the top of each column.

