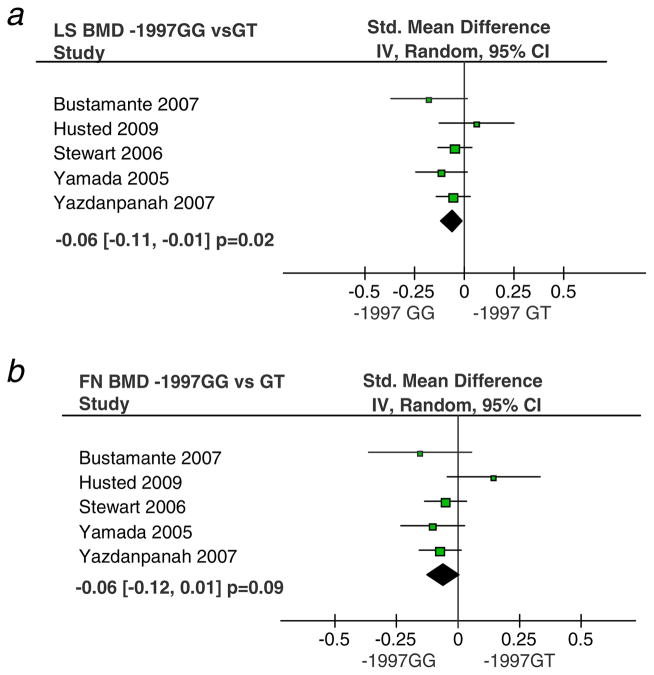
Fig. 3.
Association between -1997 G/T polymorphism and BMD in females. Comparisons are shown in panel a for lumbar spine BMD and panel b for femoral neck BMD. Each study is shown as the point estimate of the standardized mean difference with 95% confidence intervals as analyzed using a random effects model. Diamonds which lie to the left of the vertical line indicates a reduced BMD in the -1997 GG genotype compared with G/T and TT genotype groups. The p values shown have not been corrected for multiple testing

