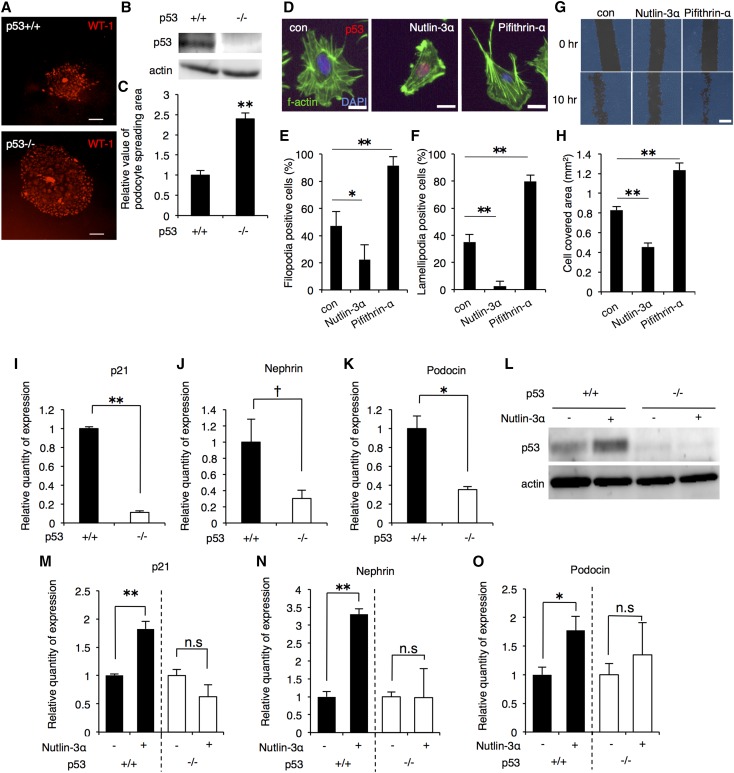
Figure 3.
p53 suppressed podocyte migration in vitro and positively regulated podocyte-specific genes. (A) Glomeruli were isolated from p53+/+ or −/− mice and cultured for 5 days. Podocytes migrate from glomeruli and proliferate as colonies.52 Migrating GECs were fixed with formalin, stained with WT-1, and visualized by immunofluorescence. Scale bars, 200 μm. (B) p53 expression in the glomeruli of p53+/+ and −/− mouse was confirmed by immunoblotting. Actin was used as loading control. (C) Podocyte-spreading area in (A) was quantified (mean±SEM, n=67–98). (D) MPC-5 cells were treated with 25 μM nutlin-3α or 50 μM pifithrin-α for 18 hours. After treatment, cells were fixed, stained with antibodies against p53 (red), F-actin (green), and DAPI (blue) and visualized by immunofluorescence. Scale bars, 20 μm. (E, F) Filopodia- and lamellipodia-positive cells were counted and ratio was calculated (mean±SEM, 33–55 cells per sample, n=4). (G) Differentiated MPC-5 cells were treated for 24 hours with 25 μM nutlin-3α or 50 μM pifithrin-α. After washout, in vitro scratch assay was performed, and cells were re-incubated for additional 10 hours. Acquisition of phase-contrast images at 0 and 10 hours was done using Bio-Revo. Scale bars, 300 μM. (H) The area covered by cells (blue field) was quantified and analyzed using Bio-Revo imaging and analysis software. Values shown are mean±SEM (con, n=7; nutlin-3α, n=7; pifithrin-α, n=9). (I-K) Primary GECs were isolated from p53+/+ or −/− mouse and cultured. Basal mRNA expression of the indicated genes was analyzed by quantitative RT-PCR (mean±SEM, n=3). (L) Primary GECs from p53+/+ or −/− mouse were treated with 25 μM nutlin-3α for 24 hours and protein lysate was extracted. p53 expression was analyzed by western blotting. Actin was used as a loading control. (M-O) Total RNA was extracted from p53+/+ or −/− primary GECs after treatment with 25 μM nutlin-3α for 24 hours. Expressions of the indicated genes were analyzed by quantitative RT-PCR. Gapdh (glyceraldehyde-3-phosphate dehydrogenase) was used as internal control. (mean±SEM, n=3). †P<0.1; *P<0.05; **P<0.01.

