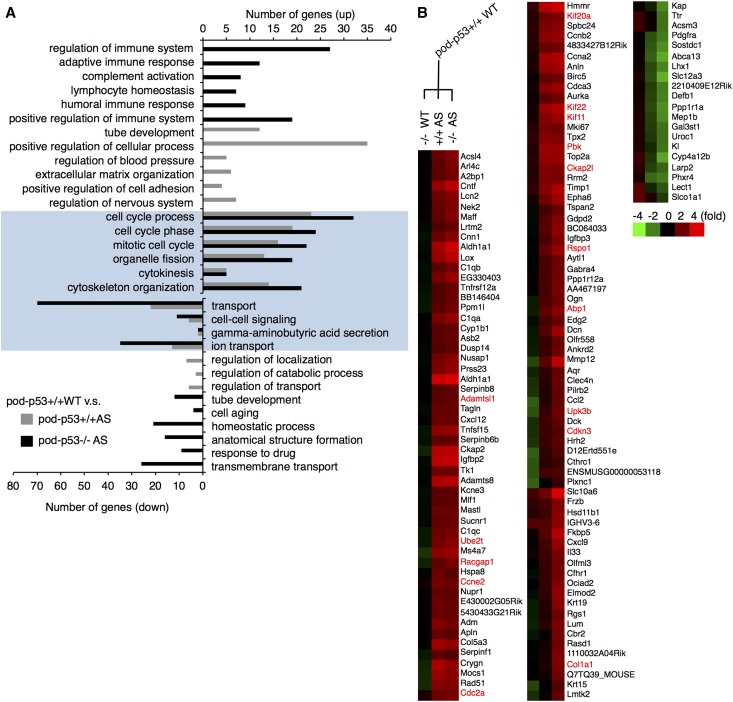
Figure 6.
Microarray analysis of gene-expression pattern in glomeruli of pod-p53+/+ and pod-p53−/− mice. Total RNA was isolated from the glomeruli of 12-week-old pod-p53+/+ or −/− WT and AS mice and analyzed by 3D-Gene DNA chip microarray (TORAY, Japan). (A) Gene ontology analysis was performed for the gene data of pod-p53+/+ AS and pod-p53−/− AS groups that were up-regulated or down-regulated statistically compared with pod-p53+/+ WT group using DAVID functional annotation. Gene categories were lined up by P value (P<0.05) and the top six categories that include up- or down-regulated genes in pod-p53+/+ AS group (gray bar), or in pod-p53−/− AS group (black bar) and common category between pod-p53+/+ and −/− AS groups (highlighted in blue) were picked up. (B) Genes were classified according to the changes in expression pattern. Clusters of genes whose AS-induced alteration of expression was enhanced by pod-p53 deletion were picked up. The red text indicates genes that are up-regulated three-fold in the kidneys of pod-p53−/− AS mice compared with pod-p53+/+ WT mice as determined by quantitative PCR shown in Supplement Figure 6B.

