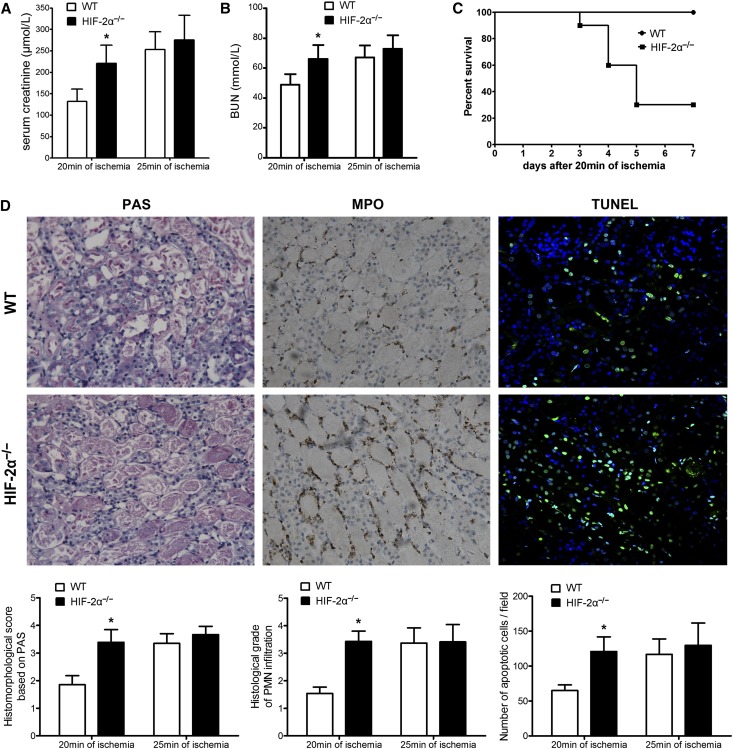
Figure 2.
The effect of T-lineage cell HIF-2α inactivation on renal IRI. HIF-2α−/− mice and WT littermates were subjected to right nephrectomy, followed by 20 or 25 min of ischemia in the left kidneys. (A) Serum creatinine and (B) BUN concentrations at 24 hours after reperfusion were shown (n=8 per group). *P<0.05 versus WT mice. (C) Survival of HIF-2α−/− and WT mice after 20 min of renal ischemia (n=20 per group). HIF-2α KO led to a significant survival disadvantage by Kaplan-Meier analysis (log-rank test, P<0.05). (D) Representative PAS, MPO staining sections and TUNEL assay in post-ischemic kidneys harvested at 24 hours from the 20-minute groups are shown. Original magnification, ×200. Abnormalities based on PAS-stained sections were graded by a semiquantitative histomorphological scoring system from 0 to 4. PMN infiltration was scored on a scale of 1–4. A summary of the quantitative analysis of apoptotic cells per field was also presented. Data are expressed as mean±SD from six to eight animals per group. *P<0.05 versus WT mice in the 20-minute group. MPO, myeloperoxidase; PAS, periodic acid–Schiff.

