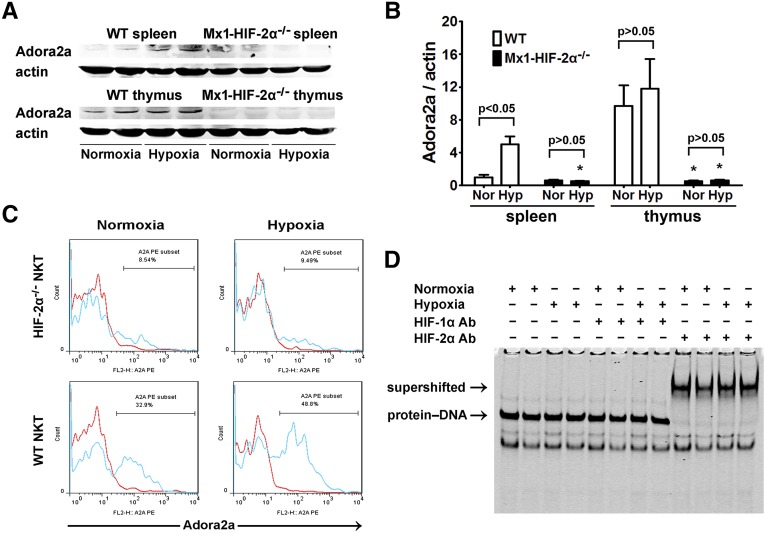
Figure 8.
Hypoxia-induced adora2a expression in splenocytes, thymocytes, and NKT cells was dependent on HIF-2α. WT and Mx1-HIF-2α−/− mice were placed in air-tight modular incubation chambers either under normoxic (21% oxygen) or hypoxic conditions (10% oxygen) for 6 hours followed by 6 hours in 21% oxygen. Then spleens and thymuses were harvested. (A) Expression of adora2a was evaluated by western blot analysis and co-detection of β-actin was performed to assess equal loading (n=4 for each group). (B) Adora2a protein bands were quantified and normalized to β-actin. Data are expressed as means±SD. *P<0.05 versus the WT controls. (C) Single-cell suspensions were prepared from spleens. After the fixation and permeabilization step, the expression of adora2a was analyzed on electronically gated NK1.1+TCR-β+ (NKT) cells. Blue lines indicate the staining of adora2a antibody, and red lines indicate the background staining with isotype-matched control IgG. Similar results were obtained in four independent experiments. (D) Thymuses were harvested from normoxia or hypoxia-treated WT mice and nuclear extracts were isolated and subjected to gel mobility shift assays using a probe from mouse adora2a promoter sequence. HIF-1α or HIF-2α antibodies were added to the reaction to generate supershifts. The protein-DNA and supershifted complexes are indicated, respectively.

