Figure 1.
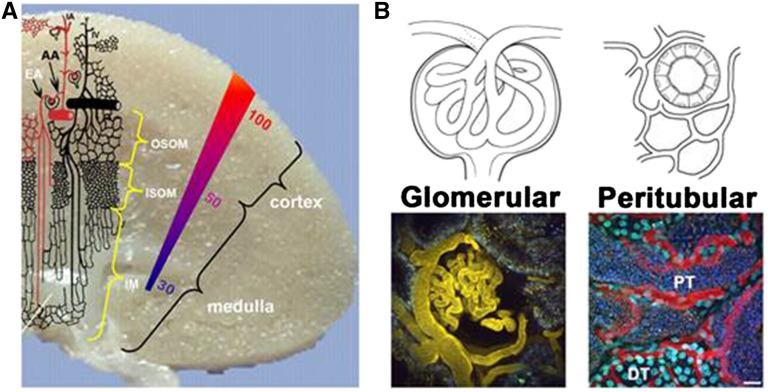
(A) Schematic representation of the microvasculature within the kidney. The colored gradient represents the oxygen tension in mmHg across the kidney. Note the lack of arterial blood in the outer medullary region. AA, afferent arteriole; EF, efferent arteriole; IA, interlobular artery; IM, inner medulla; ISOM, inner stripe of the outer medulla; OSOM, outer stripe of the outer medulla. Modified from work by Aird,60 with permission. (B) Drawings and three–dimensional two–photon images of glomerular and cortical tubular areas. Glomerular: Intravial two–photon three–dimensional micrograph showing fluorescent albumin (yellow) localized within the capillary loops of a glomerulus (center) and the microvasculature surrounding proximal tubules (PTs). Peritubular: Intravital two–photon three–dimensional micrograph showing a large molecular weight fluorescent dextran (red) localized within the peritubular capillaries (red) surrounding both PTs and distal tubules (DTs). Hoechst 33342 labels the nuclei of all cells types (cyan), with brighter binding occurring within the DTs. Note that the space between tubular structures, known as the interstitial space, is largely filled by the peritubular microvasculature under physiologic conditions. Scale bar, 20 µm.

