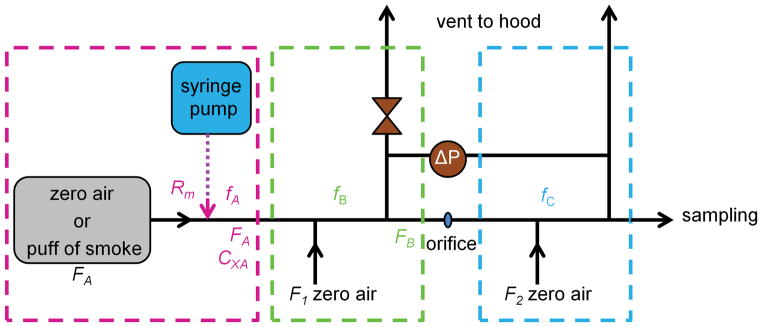
Figure 1.
Diagram of the fast-flow tube setup, where FA was the flow rate of either zero air or a puff of smoke delivered at 1.30 L/min; fA, fB, and fC were the volume fractions of a VOC in each region; Rm was the rate (μg/s) of a VOC entering the flow tube; Cx was the initial concentration (molecules/cm3) of a VOC in the flow tube; F1=F2 were dilution flows of zero air (e-cigarette: 5 L/min, cigarette: 10 L/min); and ΔP (e-cigarette: 52 torr, cigarette: 2.8 torr) was the pressure difference between sections B and C separated by a 1.25 mm orifice; the pressure difference was precisely set with a valve in section B.

