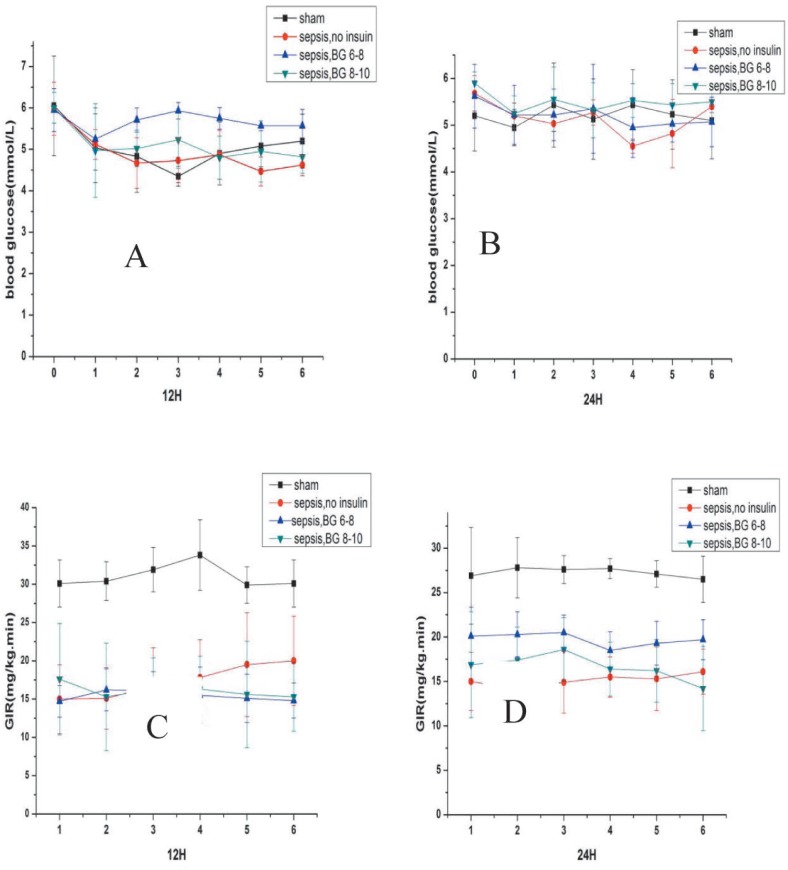
Fig. 2. Blood glucose concentration and glucose infusion rate (GIR) for the last 60 minutes during hyperinsulinaemic-euglycaemic clamp.
Values are expressed as mean ± SD. Aand B show blood glucose concentration for the last 60 minutes during hyperinsulinaemic-euglycaemic clamp experiment. ‘0’ on the x-axis means the time when fasting blood glucose concentration was taken before the clamp experiment. 1–6 on the x-axis means the last 60 minutes. C and D show the GIR for the last 60 minutes during clamp experiment.
sham: sham-operated control; sepsis, no insulin: sepsis group with only fluid maintenance; sepsis, BG 6–8: sepsis group with insulin treatment controlling blood glucose concentration at 6–8 mmol/L; sepsis, BG 8–10: sepsis group with insulin treatment controlling blood glucose concentration at 8–10 mmol/L

