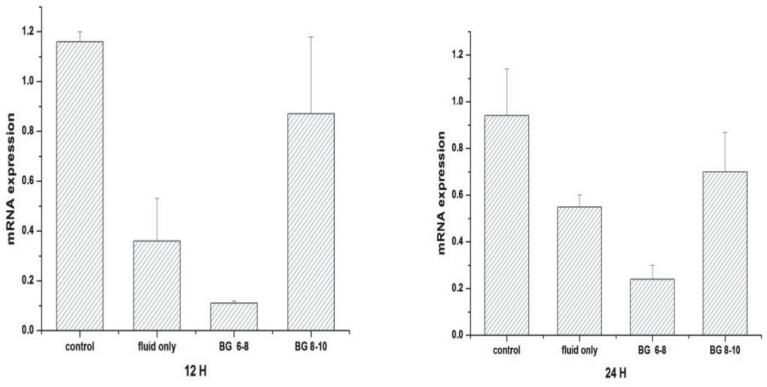
Fig. 7. Glucose transporter 4 (GLUT4) mRNA expression in skeletal muscle.
Values are expressed as mean ± SD; *p < 0.05
control: sham-operated control; fluid only: sepsis group with only fluid maintenance; BG 6–8: sepsis group with insulin treatment controlling blood glucose concentration at 6–8 mmol/L; BG 8–10: sepsis group with insulin treatment controlling blood glucose concentration at 8–10 mmol/L

