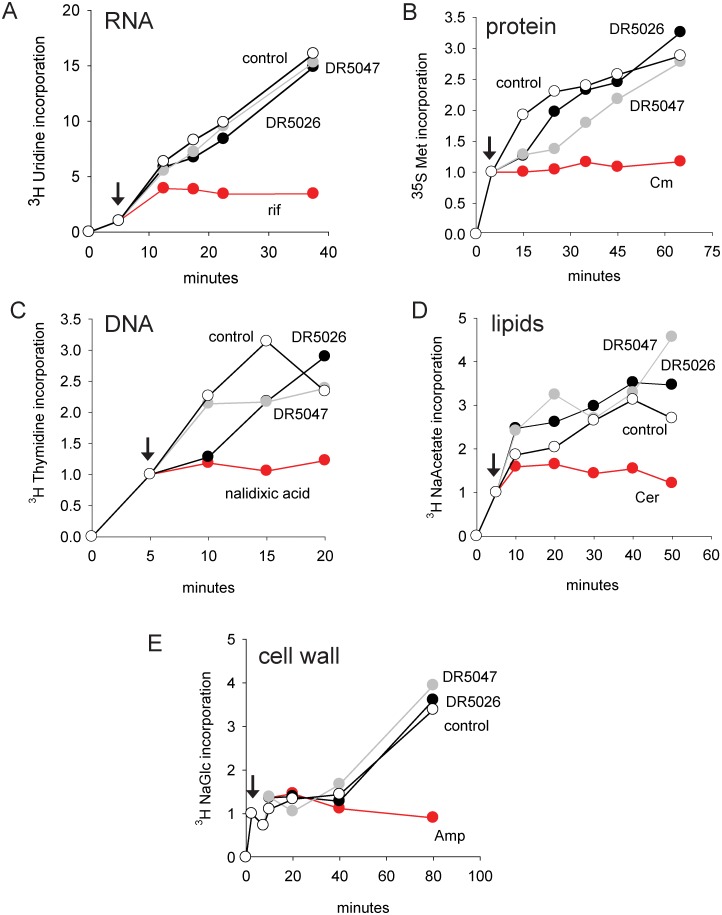
Fig 2. The effect of LPPOs on the biosynthesis of selected macromolecules.
In all panels, DR5026 is shown with black circles, DR5047 grey circles, and control (no compound added) empty circles. The red symbols depict the effect of a known inhibitor. The amount of the radiolabeled material incorporated at the time of inhibitor addition (shown with arrows) was set as 1. A. The effect on RNA synthesis. Rif, rifampicin. B. The effect on protein synthesis. Cm, chloramphenicol. C. The effect on DNA synthesis. D. The effect on lipid synthesis. Cer, cerulenin. E. The effect on cell wall synthesis. Amp, ampicillin. The experiments were conducted in three biological replicates. Representative experiments are shown. The error was below 10%.

