Fig 1. Principal components analysis.

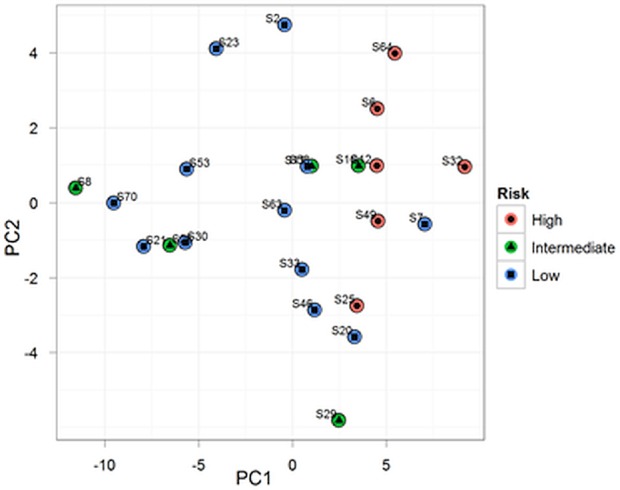
Principal components analysis performed on all samples using the top 50 miRNAs showing the highest standard deviation across all samples.

Principal components analysis performed on all samples using the top 50 miRNAs showing the highest standard deviation across all samples.