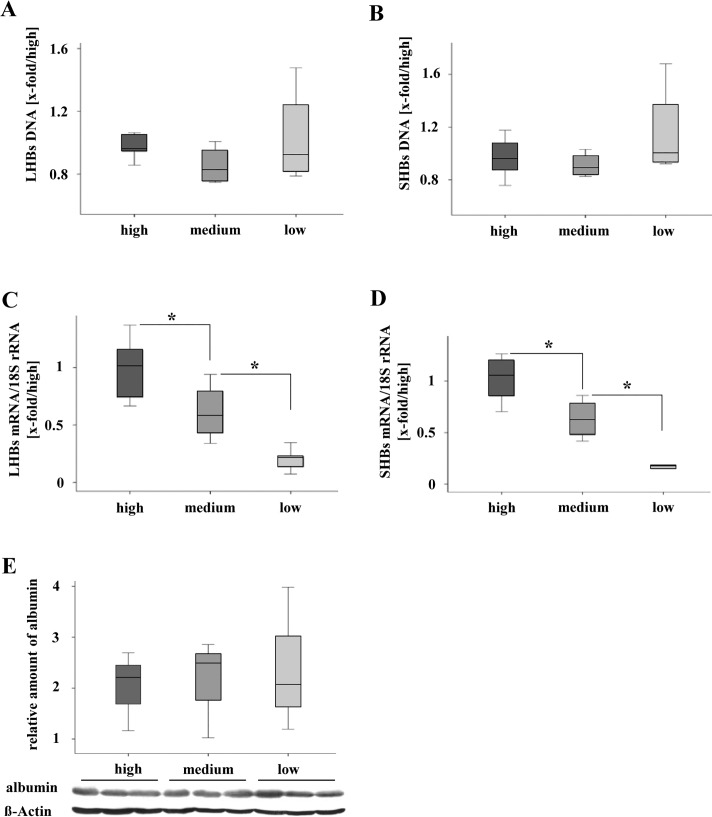
Fig 3. Analysis of transgenome integrity and transcription of HBs.
(A) and (B) qRT-PCR-analysis demonstrated stable transgenome DNA (LHBs, SHBs) in liver tissue with different amounts of HBs protein expression. Normalized to ´high´ group. (C) and (D) Significant difference of mRNA-levels (LHBs, SHBs) were shown by qRT-PCR-Analysis. Normalized to ´high´group and 18S rRNA. *P < 0.05. (E) Western blot analysis reveals equal accumulation of albumin protein among the three groups with different HBs expression.

