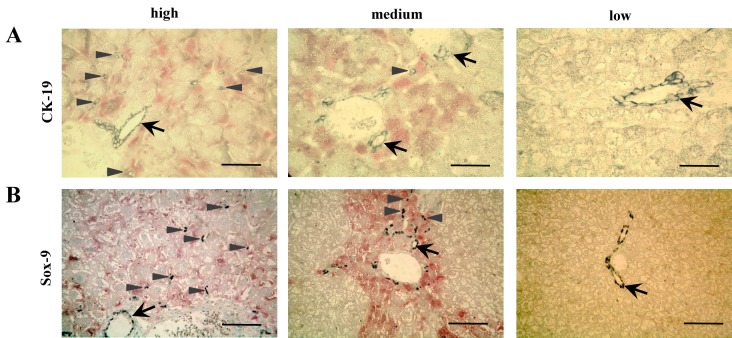
Fig 5. Loss of HBs-Expression reduced regeneration.
(A) Immunohistochemical staining of CK-19 (grey) shows that HBs expression (red) in every hepatocyte went along with higher numbers of single CK-19+-oval cells around periportal fields. Scale bar 32 μm. Arrow: CK-19 positive bile duct epithelium, arrowheads: single CK-19 positive cells in parenchyma. (B) Immunohistochemical staining of Sox-9 (black) indicates that areas with HBs expression (red) exhibited more Sox-9+-oval cells in periportal tracts and surrounding parenchyma than areas without HBs expression. Scale bar 80 μm. Arrow: Sox-9 positive cells around a bile duct, arrowhead: Sox-9 positive cells in parenchyma.

