
FIG. 7. Adding bias shifts pIC50 values closer to equivalence.
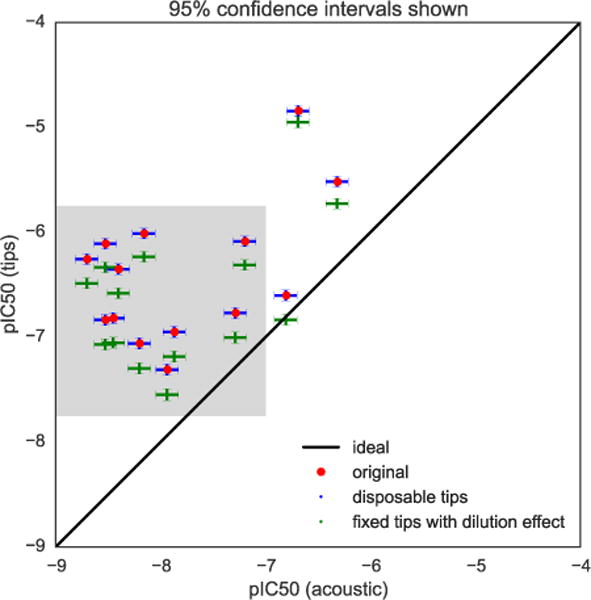
The original experimental pIC50 values obtained using from fixed tips (red) are plotted against pIC50 values from acoustic dispensing, with errors bars representing the uncertainty (shown as 95% confidence intervals) estimated by bootstrapping from our models. Since the bias is relatively sensitive to pIC50 value, here it is determined by including both the experimental value and the estimated bias. Incorporating the dilution effect from tip-based dispensing (green) shifts the experimental pIC50 values closer to concordance between tip-based and acoustic-based measurements. While this does not entirely explain all discrepancies between the two sets of data, it shifts the root mean square error between the tip-based and acoustic-based dispensing methods from 1.56 to 1.37 pIC50 units. The model also demonstrates that (1) the bias induced by the fixed tips explains much of the pIC50 shift between the two datasets, and (2) there is still a large degree of variation among the measurements not accounted for by simple imprecision in liquid transfers. This demonstrates the power of building simple error models to improve our understanding of experimental data sets. Grey box indicates portion of graph shown in Fig. 8.