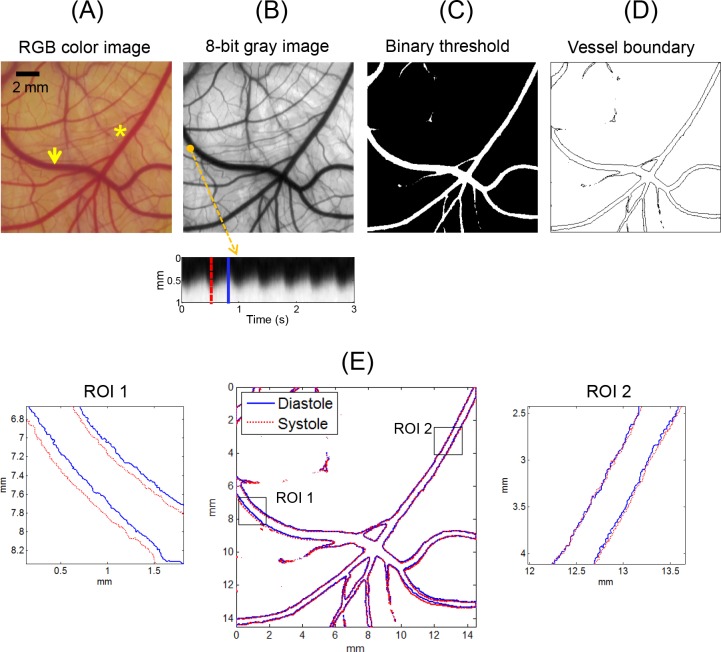
Fig 2. Schematic of vessel boundary detection.
Vessel image was obtained from the CAM of an ex ovo sample at HH stage 37 (11 days). Arrow and asterisk in (A) indicate artery and vein, respectively. Bottom panel in (B) shows the time domain plot of image brightness variation at marked position (1 mm in vertical length). (E) Systolic and diastolic geometries were superimposed on a single image. Zoomed-in images of ROIs 1 and 2 are displayed in left and right panels, respectively.

