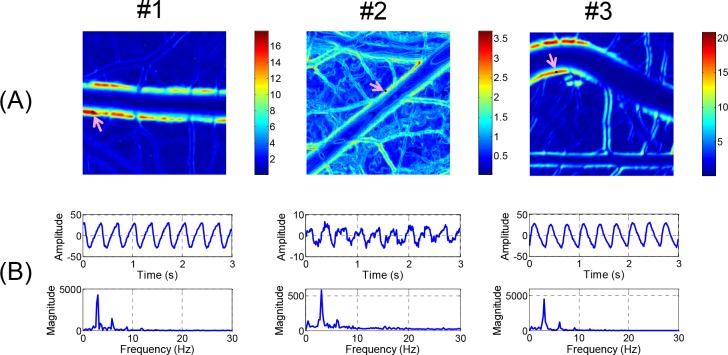
Fig 4. RMS amplitude maps and waveform analysis.
(A) Local variations of RMS amplitude corresponding to artery images in Fig 3 are presented in false color maps. (B) Time-amplitude plots and frequency spectra obtained from FFT analysis at selected points in RMS amplitude maps are displayed.

