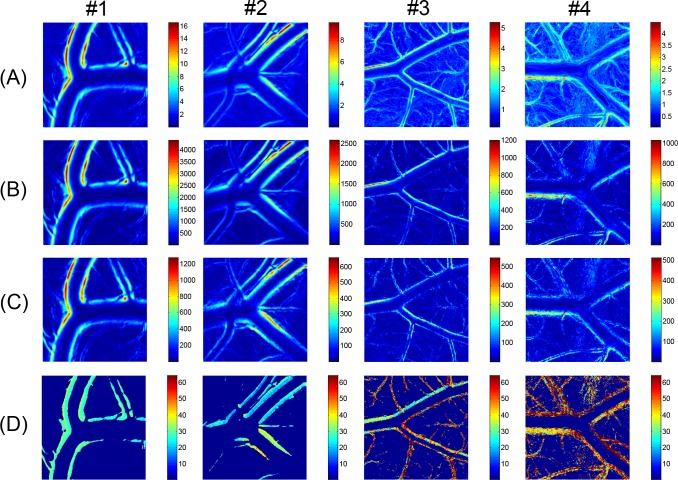
Fig 8. RMS and harmonic amplitude maps of arterial wall motion (bifurcated arteries).
FFT analysis results of arterial wall dynamics corresponding to arterial bifurcation images in Fig 7. (A) Local variations in RMS amplitude, and magnitude of (B) fundamental and (C) second harmonic components are displayed in false color maps. (D) Maps for fundamental to second harmonic magnitude ratio obtained from (B) and (C). Color bars in (D) indicate percentage of ratio.

