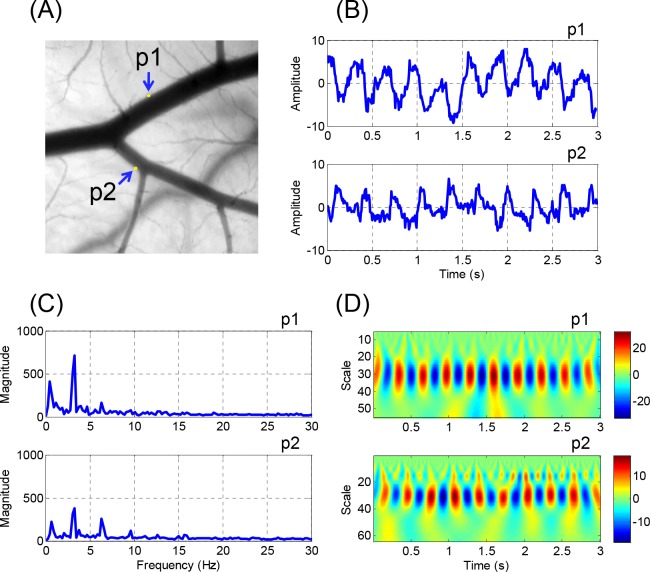
Fig 10. Representative results of wavelet transform analysis.
(A) Arterial bifurcation of case #3 is presented as a gray scale image. Pixel brightness waveforms and FFT frequency spectra at points of interests, p1 and p2, are presented in (B) and (C), respectively. (D) Wavelet scalograms at corresponding points are shown. Pseudo-frequencies for fundamental and second harmonic frequencies (3.2 and 6.4 Hz) in the FFT spectra correspond to 30.5 and 15.2 in scale in wavelet scalograms, respectively.

