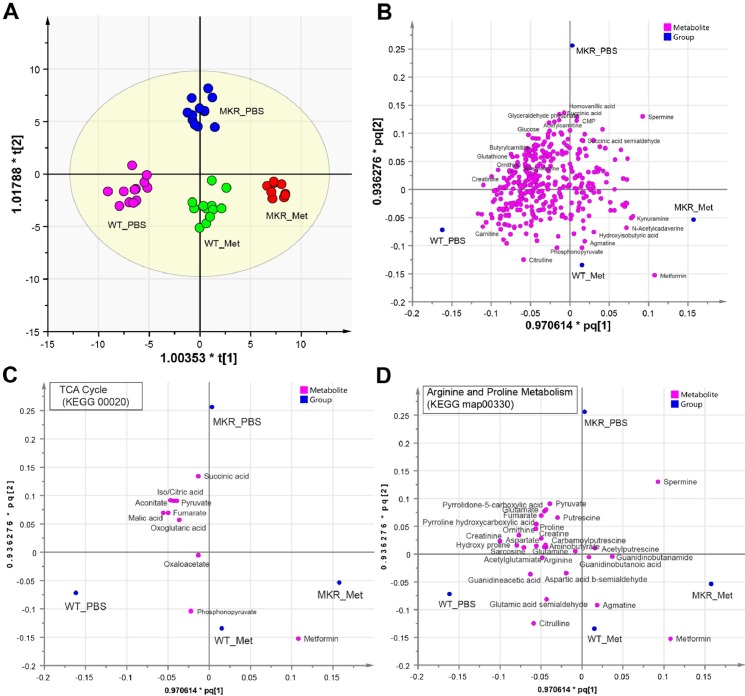
Fig 2. Metformin shifted metabolomics profiles of bone marrow in both wild-type and hyperglycemic mice.
A. The clustering scatter plot of 345 metabolites from bone marrow cells of WT and MKR mice upon metformin (Met) or control (PBS) treatment. Each dot represents one of 3 technical replicates from each of 4 biological samples (for MKR_Met, n = 3). The clustering used the O2PLS-DA model and unit-variance scaling in SIMCA. R2Y = 0.942. Q2 = 0.591. B. The scatter plot of metabolite contribution to clustering in panel A. The first and second predictive components (R2 = 0.631) from the O2PLS-DA model in panel A. are superimposed with their p and q plots. Each magenta dot represents a metabolite. Each blue dot represents the reference point for each sample group. The names were showed for a few metabolites with high discriminatory power between sample groups. Plots were generated in SIMCA. C-D. The scatter plot of metabolite contribution in two representative KEGG metabolism pathways (as in Fig 2B). All metabolites in the displayed pathway are showed if detected in this study regardless of their statistical significance. Metformin is always included as reference.

