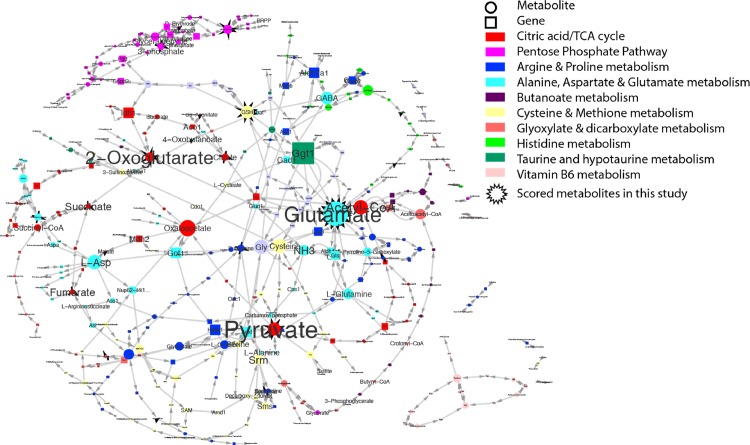
Fig 4. Potential metabolism targets of metformin revealed in this study.
KEGG metabolism pathways enriched in this study (Table 1) were merged in a focus network. The font size of each node reflects the connectivity weight (number of edges) in this focus network. Each node represents either a metabolite (circle) or a protein (square). The edges indicate directions of biochemical interactions in this network. Plot was generated in Cytoscape.

