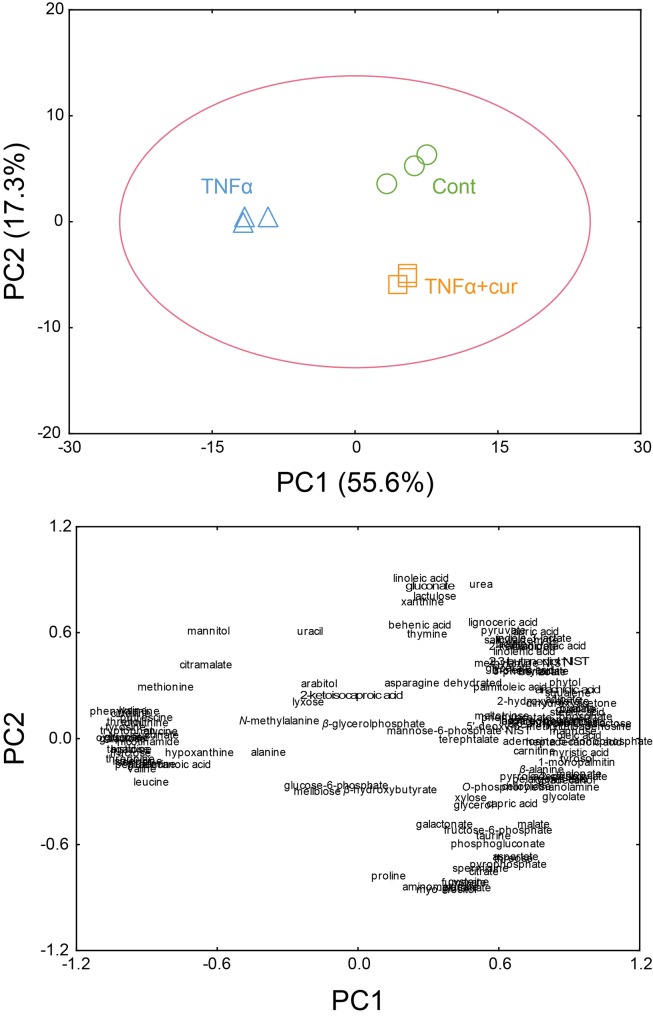
Fig 1. PCA score (A) and loading plots (B) of RA fibroblast-like synoviocytes (FLS), which were not stimulated (Control), stimulated with TNF-α (TNF), and treated with curcumin (Curcumin).
(A) Principal component (PC)1 explained the significant separation of metabolite profiles between the TNF-α-stimulated group on the negative region of the PC1, and the control and curcumin-treated groups on the positive region of the PC1. Further, the control group was clearly separated from the curcumin-treated group on PC2. (B) PC1 was explained by 84 metabolites that correlated positively with the axis, and 35 metabolites that correlated negatively.

