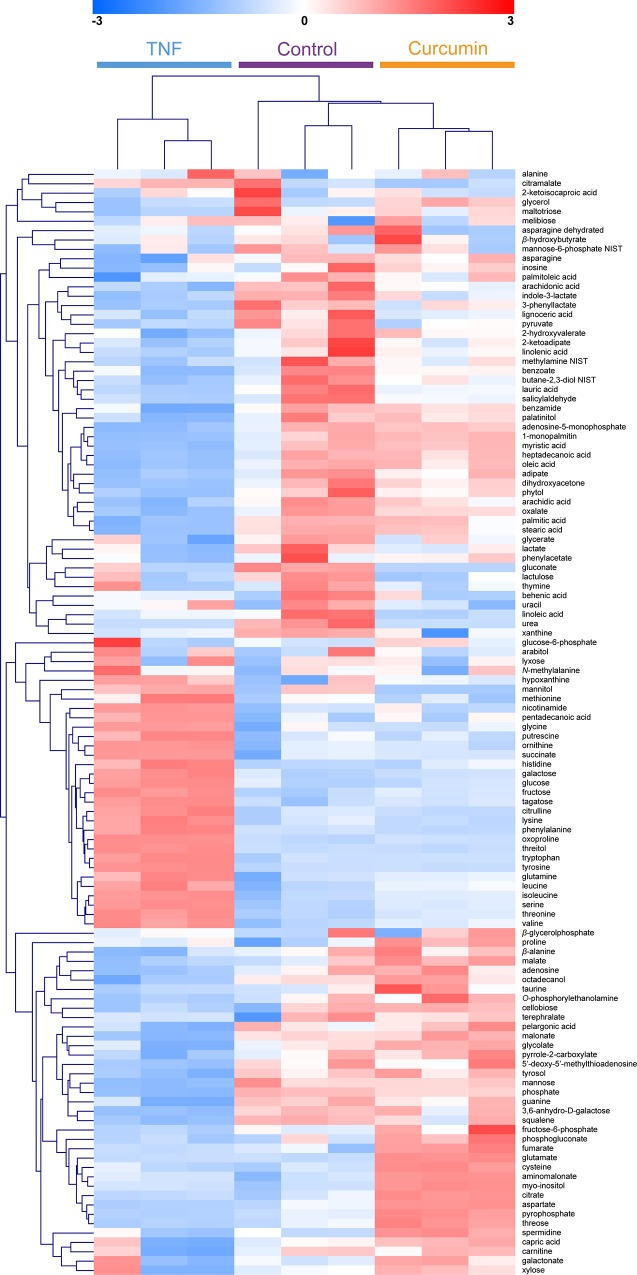
Fig 2. Hierarchical clustering analysis of 119 identified metabolites from RA FLS.
The results of heat mapping generated through metabolomic analysis and the relevant changes discovered. A heat map showed that the metabolite profiles of controls were similar to those of the curcumin-treated group. Red color reflects an increase, and blue color a decrease.

