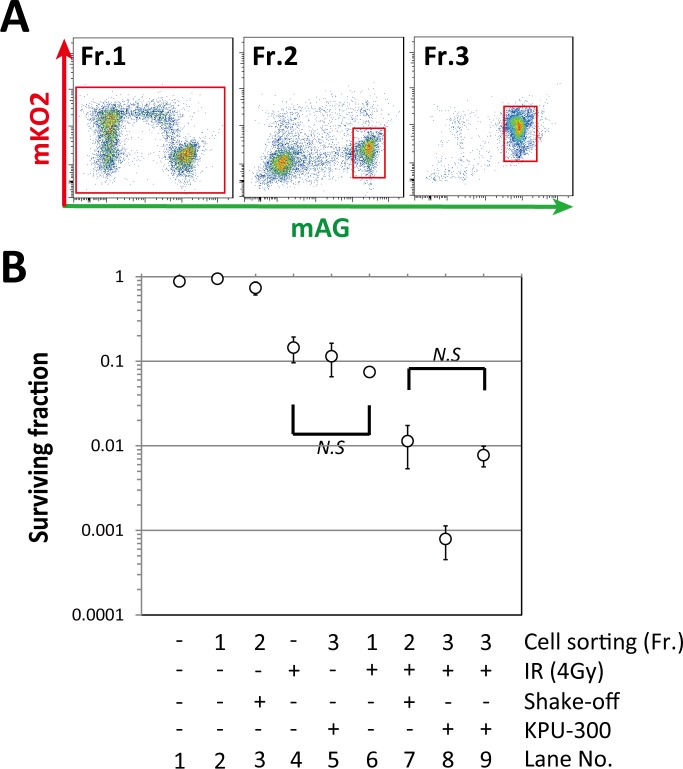
Fig 6. Radiosensitivity in cells in early M phase is comparable to that in KPU-300–treated cells.
(A) Fractions sorted by flow cytometry. Fr. 1, whole cell population; Fr. 2, cell fraction enriched in early M phase following the shake-off method; Fr. 3, cell fraction accumulated in early M phase following KPU-300 treatment for 24 h. (B) Radiosensitivity in each cell fraction following various treatments. Radiation dose was 4 Gy, and concentration of KPU-300 was 30 nM. A value of “-” in the “Fr.” row (i.e., lanes 1 and 4) indicates that cell sorting was not performed. The SF for Lane No. 9 was normalized by dividing the SF for Lane No. 8 by that for Lane No. 5. Data represent means ± S.E. of values obtained from three independent experiments. Error bars are not displayed when they would have been smaller than the circular symbol indicating the mean. N.S., not significant by either ANOVA or t-test.

