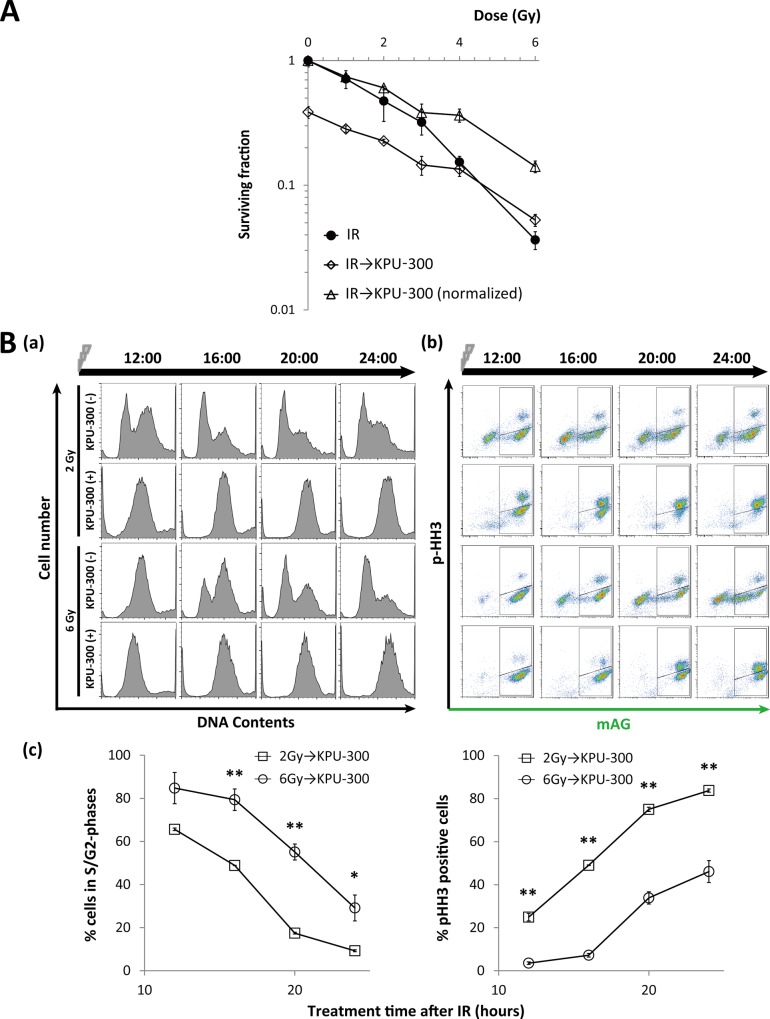
Fig 7. Radiosensitivity and cell cycle kinetics of cells subjected to KPU-300 treatment after irradiation.
(A) Survival curves in HeLa-Fucci cells treated with KPU-300 after irradiation. Cells were treated with 30 nM KPU-300 for 24 h immediately after irradiation, and then prepared for colony-forming assay. For normalization, the curve for combined treatment was shifted upward so as to obtain the surviving fraction 1 at 0 Gy. Data represent means ± S.E. of values obtained from three independent experiments. (B) Cell cycle kinetics after the same treatment described in Fig 7A. (a) Time course of DNA content with or without KPU-300 treatment after 2 Gy or 6 Gy irradiation. (b) Time course of two-dimensional flow-cytometric analysis to detect green fluorescence and an M-phase marker. The acquired time points are shown as hours:minutes in each image. (c) Quantitative analysis of green cells (left panel) and M-phase cells (right panel) after the same treatment described in Fig 7A. Data represent means ± S.E. of values obtained from three independent experiments. *, p < 0.05; **, p < 0.01 vs. lower values for the same time points.

