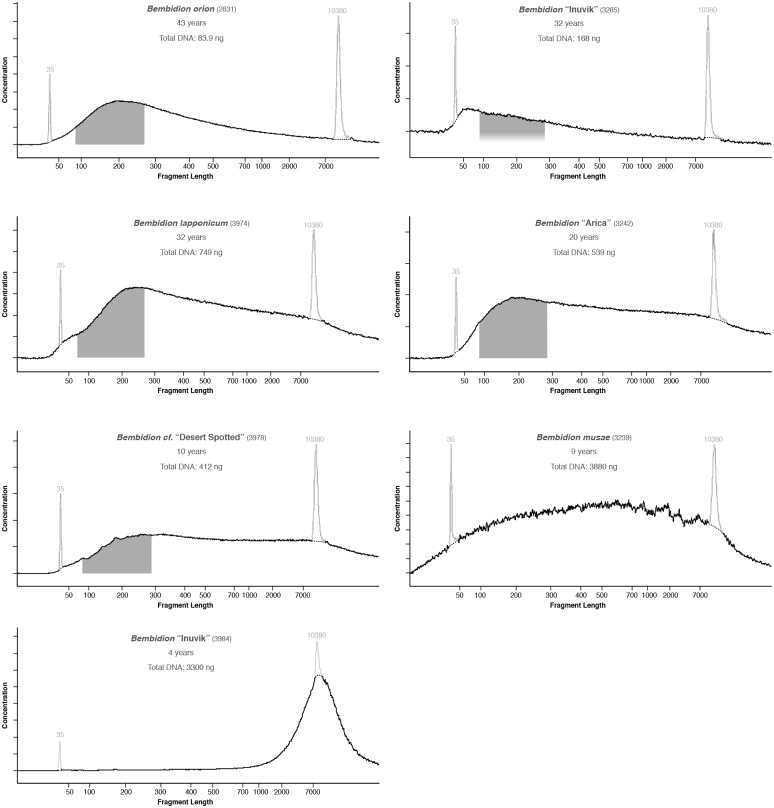
Fig 5. Electropherograms of DNA extracted from younger museum specimens that were subsequently used in library preparation.
Pale spikes at 35 and 10380 bases represent standards included in each analysis. Dark shaded regions, when present, correspond to range of fragments that were selected and sequenced on the Illumina HiSeq 2000. Regions are not shown for Bembidion musae or Bembidion “Inuvik” 3984 as the DNA in those samples was sonicated prior to library preparation. For each specimen, age and total DNA in the extraction is also shown.

