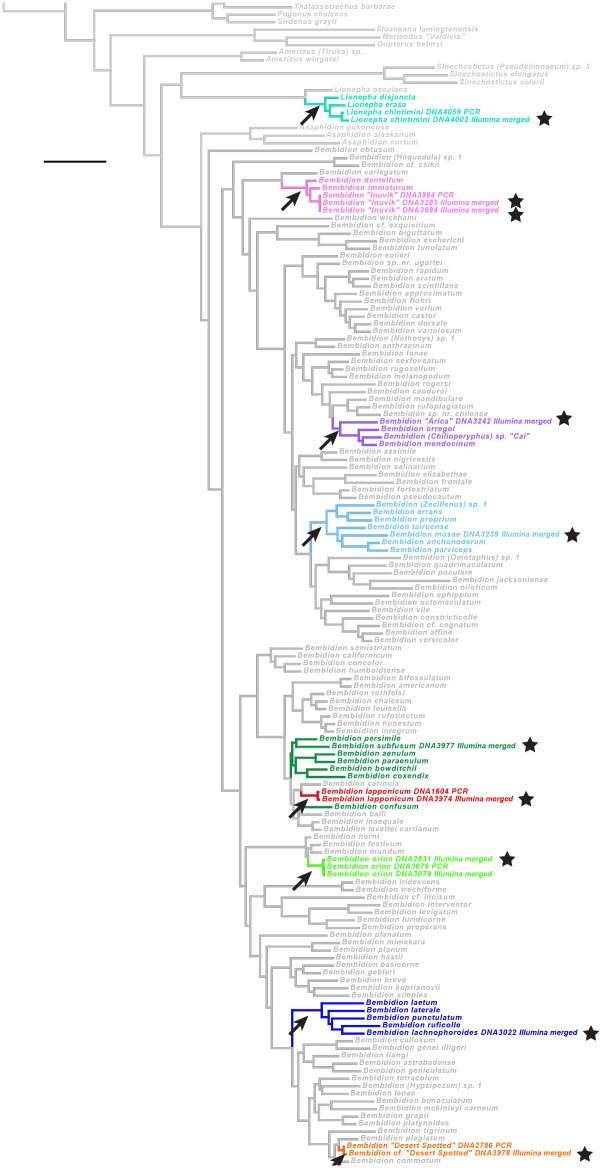
Fig 14. A maximum likelihood tree of carabids from seven focal genes and IlluminaMerged sequences.
The placement of the IlluminaMerged sequences is shown relative to their prediction groups in a concatenated analysis of seven focal genes. Each prediction group is marked by a black arrow, and with a unique color for branches and taxon names of all specimens in the prediction group. The placement of each IlluminaMerged sequences is indicated with a black star.

