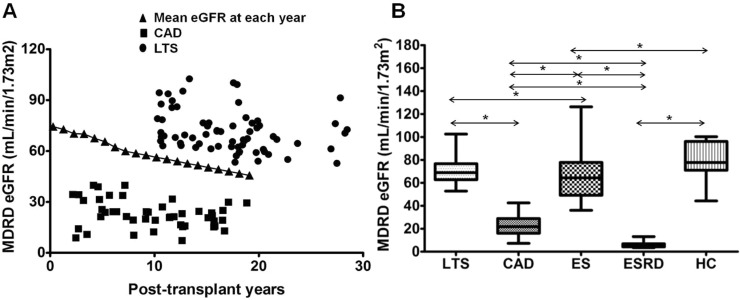
Fig 1. Distribution of allograft function in each study group.
(A) Distribution of subjects according to allograft function and post-transplant years in LTS group and CAD group. Closed triangle mean the average value of MDRD eGFR at each post-transplant year in 587 patients who took kidney transplantation between 1995 and 2010 and current laboratory data is available in our center. (B) Comparison of allograft function assessed by MDRD eGFR in each study and control group. Note that allograft function was significantly superior in LTS group compared to CAD group. * P<0.05 for each comparison. LTS, long term stable; CAD, chronic allograft dysfunction; ES, early stable; ESRD, end stage renal disease; HC, healthy control; MDRD eGFR; Modification of Diet in Renal Disease estimated glomerular filtration rate.

